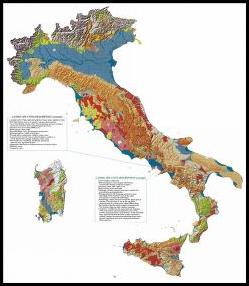
Mappa mundi
One of the things I particularly like about geology is the maps. I like maps in any case, figuring out what the symbols represent, and revelling in the details. There is also something very artistically right with the Ordnance Survey's 1:25,000 scale Explorer maps, even with their limited colour palette (not quite so fond of the 1:50,000 scale Landranger maps, though these have their place). Admiralty Charts are also interesting, but seen from the opposite point of view, in that OS maps are interested in the land, and include all sorts of landmarks, streets and onshore stuff; whereas Admiralty Charts pooh-pooh the land (except where there might be a couple of tall chimneys) as being fit only for land-lubbers, and lovingly detail every change in the sea bed, showing where lights, wrecks and pipelines run.But geological maps are the best, because they're coloured. They make no concession to land use, or even the actual colour of most rocks (which, although varied, doesn't tend to be as bright as the maps show). For example, igneous rocks such as basalt are usually shown on maps as bright scarlets and fuschia-pinks. Igneous rocks are occasionally pink, but never quite so brightly, luminously, excitingly so. The idea when looking at a geological map is to imagine all the soil, vegetation, tarmac and concrete stripped off the bones of the land, so that you're looking directly at the bedrock from above.
So here's Tamburlaine's guide for interpreting geological maps:

Colours:
Igneous rocks - usually bright reds, pinks and lime green colours;
Metamorphic rocks - often purple or light pink;
Sedimentary rocks - mudstones tend to be dark colours, browns and greens; sandstones yellow or orange; limestones blue.
This is not always the case, particularly for non-UK maps, but it serves as a reasonable guide.
Lines:
Thick black lines - faults or thrusts
Thinner black lines - lines of folds, or geological boundaries
Shape of lines:
If fault and boundary lines are wiggly, running parallel to the topographic contours, then the fault or the geology is relatively flat-lying. If the lines are straight, cutting straight across, then the fault or boundary is vertical.
So there you go! Geological maps can show why the landscape is as it is, and why some slopes are steep, and why others aren't, and why rivers drain in the way they do.

2 Comments:
Oh yes. I too love maps. I only did geology at O level, but loved interpreting them, and drawing cross-sections.
for the past 22 years i've had a british parks department (whatever it's called) map, beautifully hand inked, of Stonehenge on my wall. this makes people think i am a wiccan. i am not a wiccan. i am a nerd. i also have one of the Avebury Stones waiting to be framed. i also have a sick thing for the Natl Geo maps. my favorite? nothing better than a hand done, detailed, oldschool topo map.
yep. nerd.
Post a Comment
<< Home